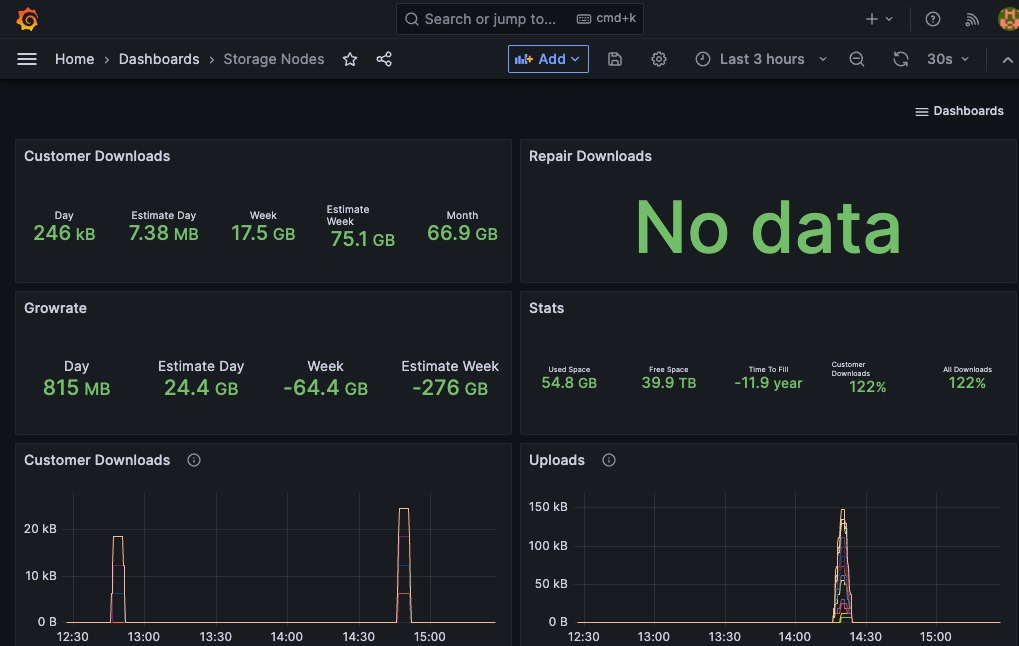
Node Dashboard
This guide assists commercial Storage Node operators in setting up advanced monitoring using Prometheus and Grafana. There are alternative monitoring tools that also will work. Consider the following as guidelines rather than a strict requirement for how to do it.
This guide is for Commerical Storage Nodes, if you're looking to join the public network follow Quickstart Node Setup instead.
Prerequisites
- Familiarity with or installed Prometheus
- Familiarity with or installed Grafana
Metrics
Storage nodes have a Prometheus metrics endpoint that can be scraped periodically for better insight on the health of your network.
To enable the endpoint set the STORJ_DEBUG_ADDR or --debug.addr flag for each Storage node (incrementing the port by 1 if multiple nodes are on the same machine).
Visit 127.0.0.1:6000 for an overview page of monitoring capabilities. More specifically, the /metrics endpoint can be viewed for a more specific overview of what is available
Prometheus configuration
Next, create a prometheus.yaml configured to scrape the Storage nodes in your network.
List each Storage Node's debug address and port as targets.
/metrics is added by prometheus targets by default
Run the Prometheus docker container or update your existing Prometheus server config
Visit the Prometheus targets (http://localhost:9090/targets) to see if the Storage Nodes are being successfully scraped.
Grafana Dashboard
Once metrics are being successfully gathered, they can be visualized and analyzed with Grafana.
Run the Grafana docker container or add the following to your existing one.
Login to Grafana by visiting http://localhost:3000 (username and password is admin by default).
Connect Prometheus to your Grafana instance
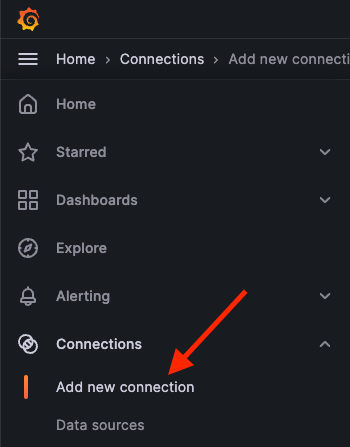
To view the metrics data in Grafana, you'll need to create a new Prometheus data source.
Click Add new connection from the left sidebar under connections.
Select Prometheus as the data source
Enter your Prometheus server URL (e.g. http://localhost:9090) under connections
Click Save & test
Add Storage Node Dashboard
Navigate to the Dashboards http://localhost:3000/dashboards
Click Create Dashboard in the middle of the screen or the New if you already have an existing one
Select the Import a dashboard option
Paste the JSON from storage-node-grafana.json into Import via dashboard JSON model text area.
Click Load and Import to create the Dashboard.
You've successfully setup your Storage node dashboard.
It may say "No data" for each graph until an upload or download to your Storage Nodes occurs.